Intro
As we get into the soft freeze period starting tomorrow, it is necessary to have a reference of whether there were some performance improvements or degradations across targets between QEMU 5.0 released back in April and the current version of QEMU before the soft freeze.
The report doesn’t introduce a new script, it instead follows the same procedures and uses the same tools from the previous report to dissect - using dissect.py - the execution of 17 different QEMU targets when running the double version of the Coulomb benchmark. It compares the results obtained from running with QEMU 5.0 (same as previous report) and QEMU 5.1-pre-soft-freeze.
Table of Contents
QEMU 5.0 Results
| Target | Total Instructions | Code Generation % | JIT Execution % | Helpers Execution % |
|---|---|---|---|---|
| aarch64 | 4 692 357 988 | 2.758% | 32.437% | 64.804% |
| alpha | 10 804 422 926 | 0.958% | 11.042% | 88.000% |
| arm | 39 325 544 973 | 0.483% | 76.003% | 23.514% |
| hppa | 12 005 435 084 | 0.975% | 8.988% | 90.037% |
| m68k | 7 266 676 762 | 1.116% | 5.904% | 92.980% |
| mips | 10 440 969 560 | 1.366% | 10.643% | 87.990% |
| mipsel | 11 715 714 129 | 1.247% | 10.012% | 88.741% |
| mips64 | 10 337 898 389 | 1.409% | 9.790% | 88.801% |
| mips64el | 11 596 334 956 | 1.281% | 9.118% | 89.601% |
| ppc | 12 713 132 146 | 1.115% | 10.215% | 88.671% |
| ppc64 | 12 716 587 866 | 1.122% | 9.760% | 89.119% |
| ppc64le | 12 694 752 808 | 1.118% | 9.611% | 89.271% |
| riscv64 | 4 149 509 947 | 5.626% | 19.113% | 75.261% |
| s390x | 10 946 821 241 | 0.843% | 8.850% | 90.307% |
| sh4 | 12 728 200 623 | 1.344% | 18.057% | 80.598% |
| sparc64 | 11 979 151 647 | 5.634% | 12.907% | 81.459% |
| x86_64 | 4 703 175 766 | 2.469% | 23.005% | 74.526% |
QEMU 5.1-pre-soft-freeze Results
| Target | Total Instructions | Code Generation % | JIT Execution % | Helpers Execution % |
|---|---|---|---|---|
| aarch64 | 4 425 884 385 | 2.879% | 32.527% | 64.594% |
| alpha | 10 721 648 979 | 0.978% | 11.127% | 87.895% |
| arm | 39 330 148 784 | 0.495% | 75.994% | 23.511% |
| hppa | 12 008 517 216 | 0.993% | 8.985% | 90.021% |
| m68k | 6 934 475 789 | 1.217% | 6.187% | 92.596% |
| mips | 9 959 222 546 | 1.442% | 11.158% | 87.399% |
| mipsel | 11 124 915 402 | 1.322% | 10.544% | 88.134% |
| mips64 | 9 857 099 976 | 1.492% | 10.267% | 88.241% |
| mips64el | 11 006 401 550 | 1.362% | 9.606% | 89.032% |
| ppc | 13 033 447 522 | 1.095% | 9.964% | 88.941% |
| ppc64 | 13 036 297 838 | 1.101% | 9.520% | 89.378% |
| ppc64le | 13 014 446 880 | 1.098% | 9.375% | 89.527% |
| riscv64 | 4 060 070 883 | 5.727% | 19.534% | 74.739% |
| s390x | 11 012 778 376 | 0.847% | 8.797% | 90.356% |
| sh4 | 12 730 089 213 | 1.352% | 18.054% | 80.594% |
| sparc64 | 11 972 339 288 | 5.573% | 12.914% | 81.513% |
| x86_64 | 4 627 526 331 | 2.537% | 23.381% | 74.082% |
Summary of Results
In the 5.1-pre-soft-freeze results table, if the number of instructions is marked in green, it indicates a decrease in the number compared to QEMU 5.0. This in turn, means an increase in performance. Using red indicates otherwise.
The table below gives a summary of the results. It lists which targets had a decrease, no change or an increase in their performance from QEMU 5.0 to QEMU 5.1-pre-soft-freeze. A relative threshold of 1% is used for comparison.
| Decrease | No Change | Increase |
|---|---|---|
|
ppc
2.458%
|
alpha
0.766%
|
aarch64
5.679%
|
|
ppc64
2.453%
|
arm
0.012%
|
m68k
4.572%
|
|
ppc64le
2.456%
|
hppa
0.026%
|
mips
4.614%
|
|
s390x
0.599%
|
mipsel
5.043%
|
|
|
sh4
0.015%
|
mips64
4.651%
|
|
|
sparc64
0.057%
|
mips64el
5.087%
|
|
|
riscv64
2.155%
|
||
|
x86_64
1.609%
|
Discussion of Results
To be able to pin point the cause of the performance degradation introduced in QEMU 5.1-pre-soft-freeze for the PowerPC targets, it’s time to introduce a new tool to visualize the output of Callgrind.
Introducing KCachegrind
KCachegrind is a tool for interpreting Callgrind output, same as callgrind_annotate, but instead of using a CLI, it provides a rich GUI interface with far more features than the latter. For further instructions on installation, please check the appendix.
This report will utilize KCachegrind for listing the helper functions executed by QEMU. In the next report, a Python script will be presented for easily doing so without the need to deal with KCachegrind at all.
Listing Executed QEMU helpers
Assuming that QEMU 5.0 build is located at <qemu-build> and QEMU 5.1-pre-soft-freeze is at <qemu-master-build>, Callgrind should be run first to obtain the profiling output for both versions of QEMU.
valgrind --tool=callgrind --callgrind-out-file=ppc_5.out <qemu-build>/ppc-linux-user/qemu-ppc coulomb_double-ppc &&
valgrind --tool=callgrind --callgrind-out-file=ppc_pre-soft-freeze.out <qemu-master-build>/ppc-linux-user/qemu-ppc coulomb_double-ppc
The resulting Callgrind output files can now be opened in KCachegrind. The list of helpers executed by QEMU is in the bottom right section:
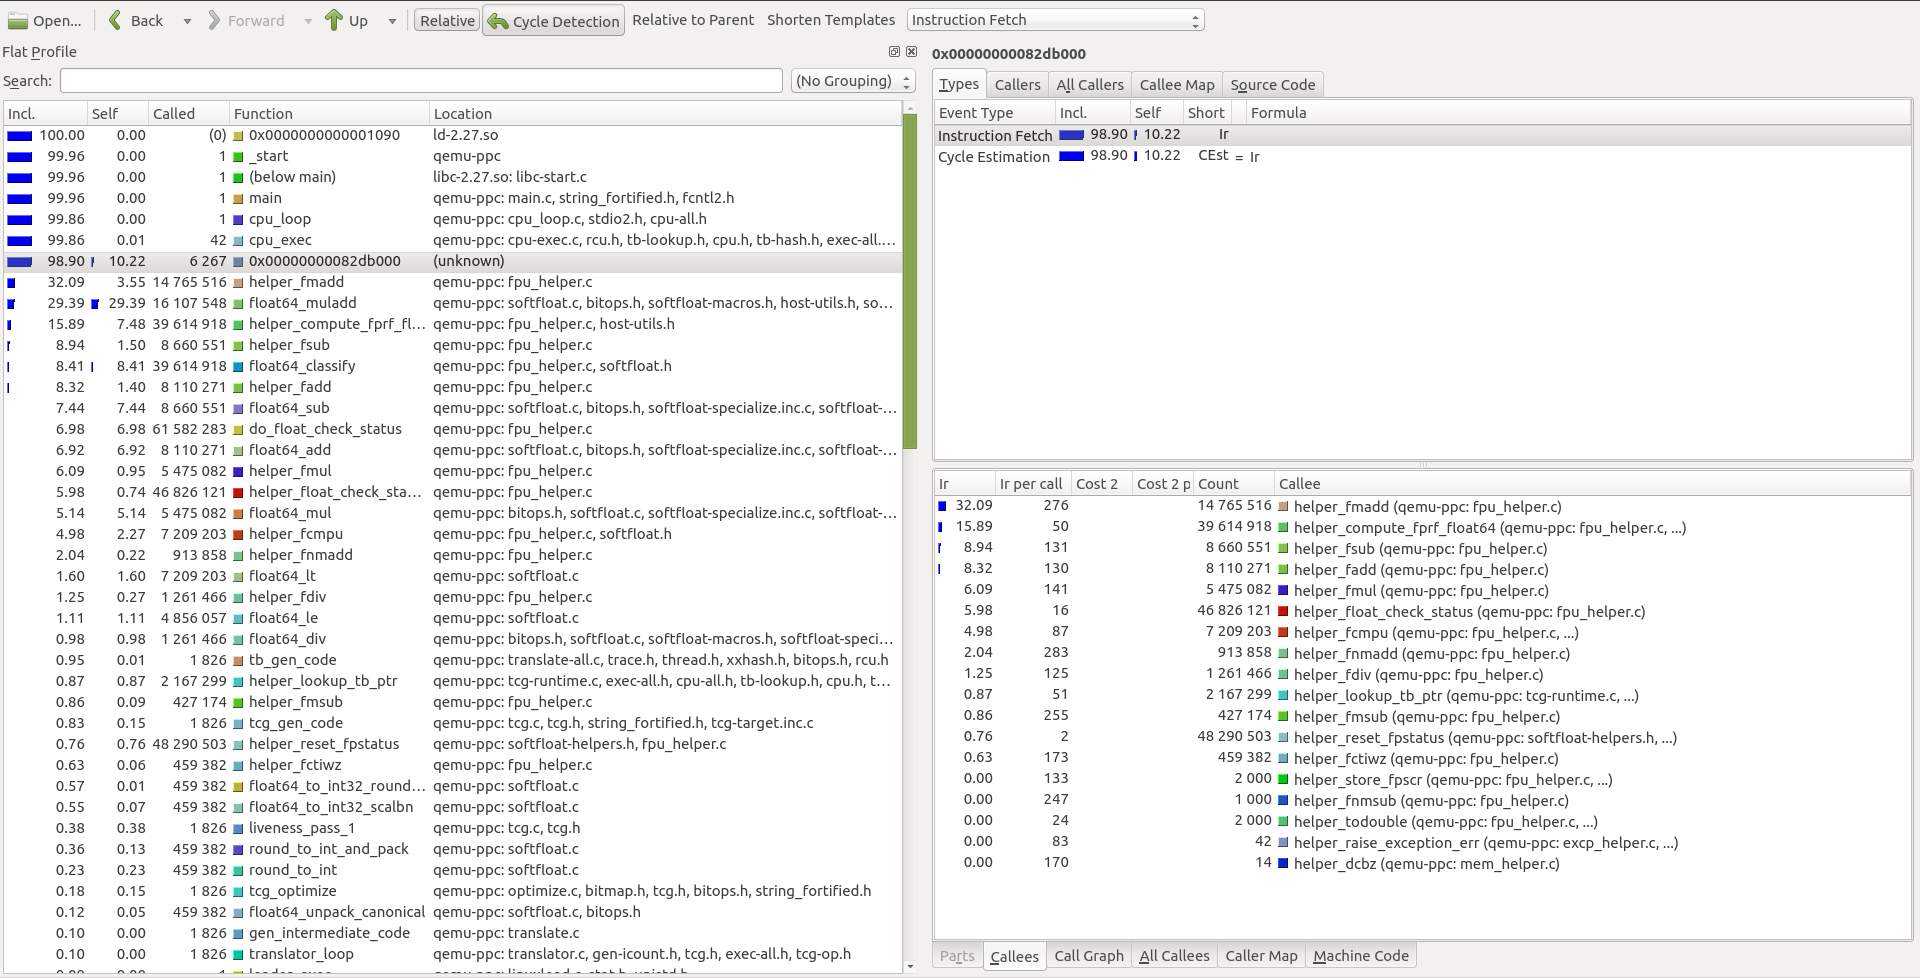
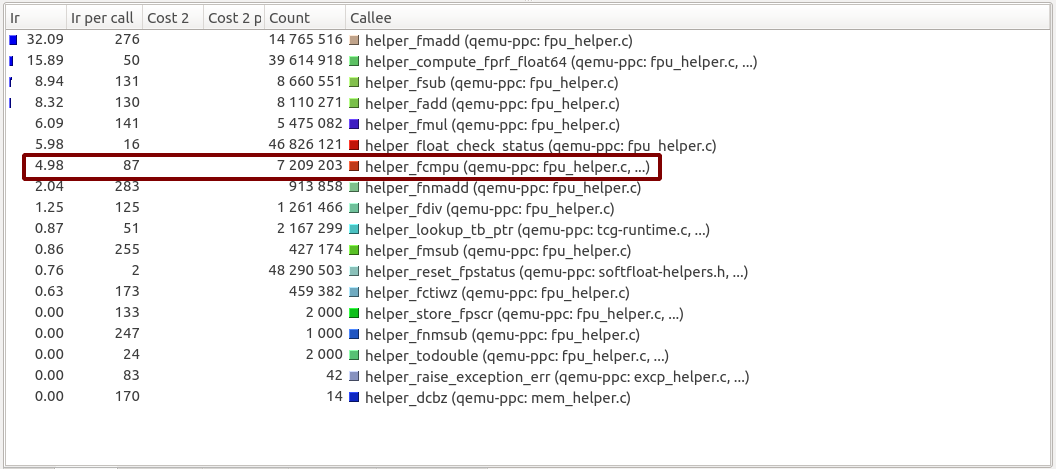
Helpers Executed in QEMU 5.0:
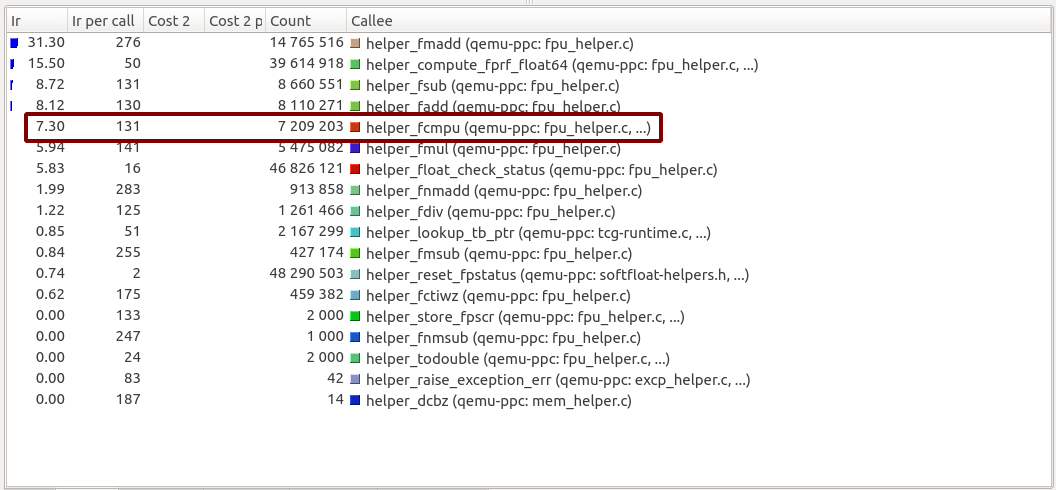
Helpers Executed in QEMU 5.1-pre-soft-freeze:
The results shown above also match for the ppc64 and ppc64le targets.
Comparison of Results
For both versions, QEMU executes the same list of helper functions. All functions have an identical number of calls and instructions per call except for only one, helper_fcmpu. The function still has the same number of calls in QEMU 5.1-pre-soft-freeze (7 209 203), but the number of instructions per call jumped from being 87 to 131.
To further inspect the reason behind this, double click on helper_fcmpu to list the function callees.
Callees of helper_fcmpu in QEMU 5.0:
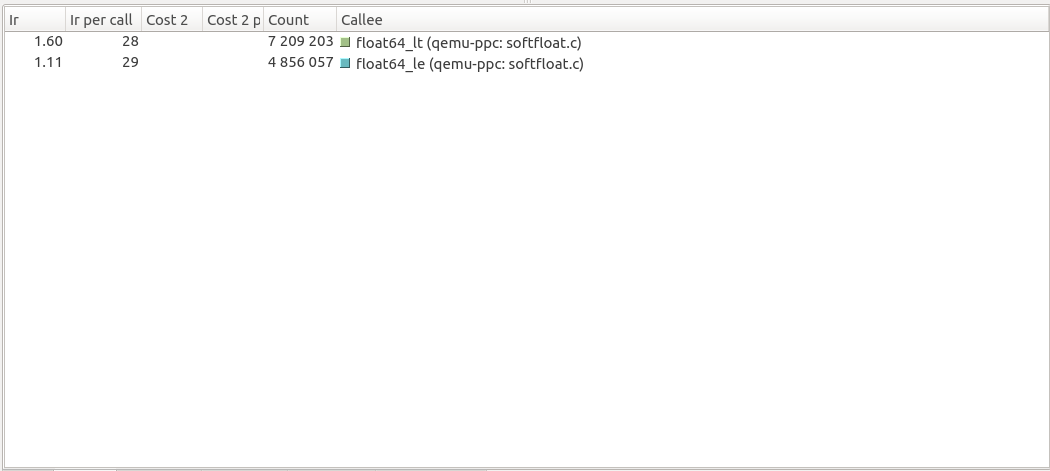
Callees of helper_fcmpu in QEMU 5.1-pre-soft-freeze:
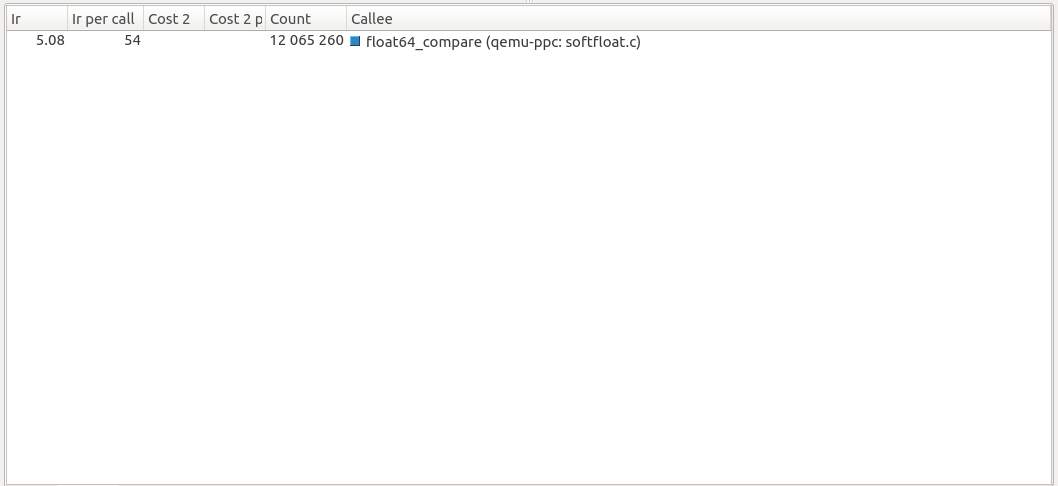
Analysis of Results
Looking at the source code of the two QEMU versions, both float64_lt and float64_le were inlined in QEMU 5.1-pre-soft-feeze. They were both updated to call float64_compare instead of each having its own separate implementation. This can be inferred by summing their number of calls in QEMU 5.0 (7 209 203 + 4 856 057 = 12 065 260) which is the same number of calls for float64_compare in QEMU 5.1-pre-soft-freeze.
The approach followed in QEMU 5.1-pre-soft-freeze obviously increases the maintainability of the code, but the downside of doing so is that float64_compare - which calls f64_compare under the hood - is more of a generic function. It isn’t as optimized as float64_lt and float64_le which are built for performing single comparison operations. As a result, the number of instructions executed in float64_compare is nearly double that of float64_lt and float64_le.
The total number of instructions for helper_fcmpu can be easily calculated as follows:
QEMU 5.0
-
Total instructions for
float64_lt: 28 * 7 209 203 = 201 857 684 -
Total instructions for
float64_le: 26 * 4 856 057 = 126 257 482 -
Total instructions for both functions: 201 857 684 + 126 257 482 = 328 115 166
QEMU 5.1-pre-soft-float
- Total instructions for
float64_compare: 54 * 12 065 260 = 651 524 040
To conclude the analysis section, the performance degradation introduced in the PowerPC targets - which is approx 2.45% - isn’t critical, but it should be noted that maintainability sometimes comes at a performance cost. The decision of whether to use multiple optimized functions as float64_lt and float64_le, or to use a single generic function as f64_compare depends on the priorities of the developer. Either way, any major change in the source code should be followed by performance benchmarking to determine if that change is really worth it.
Appendix
Installing KCachegrind
CentOS & RHEL
sudo yum install kdesdk-KCachegrind
Fedora
sudo dnf install KCachegrind
Arch
1- Enable the extra repository on /etc/pacman.conf:
[extra]
Include = /etc/pacman.d/mirrorlist
2- Install KCachegrind zst package:
sudo pacman -Syu KCachegrind
Debian & Derivatives
sudo apt-get update && sudo apt-get install KCachegrind